
Usage and results
Two Console tabs answer two different questions. Usage answers how much am I using, and what is it costing me - in aggregate, over time, per key. Results answers what exactly did the API return for that one request.
Usage charts
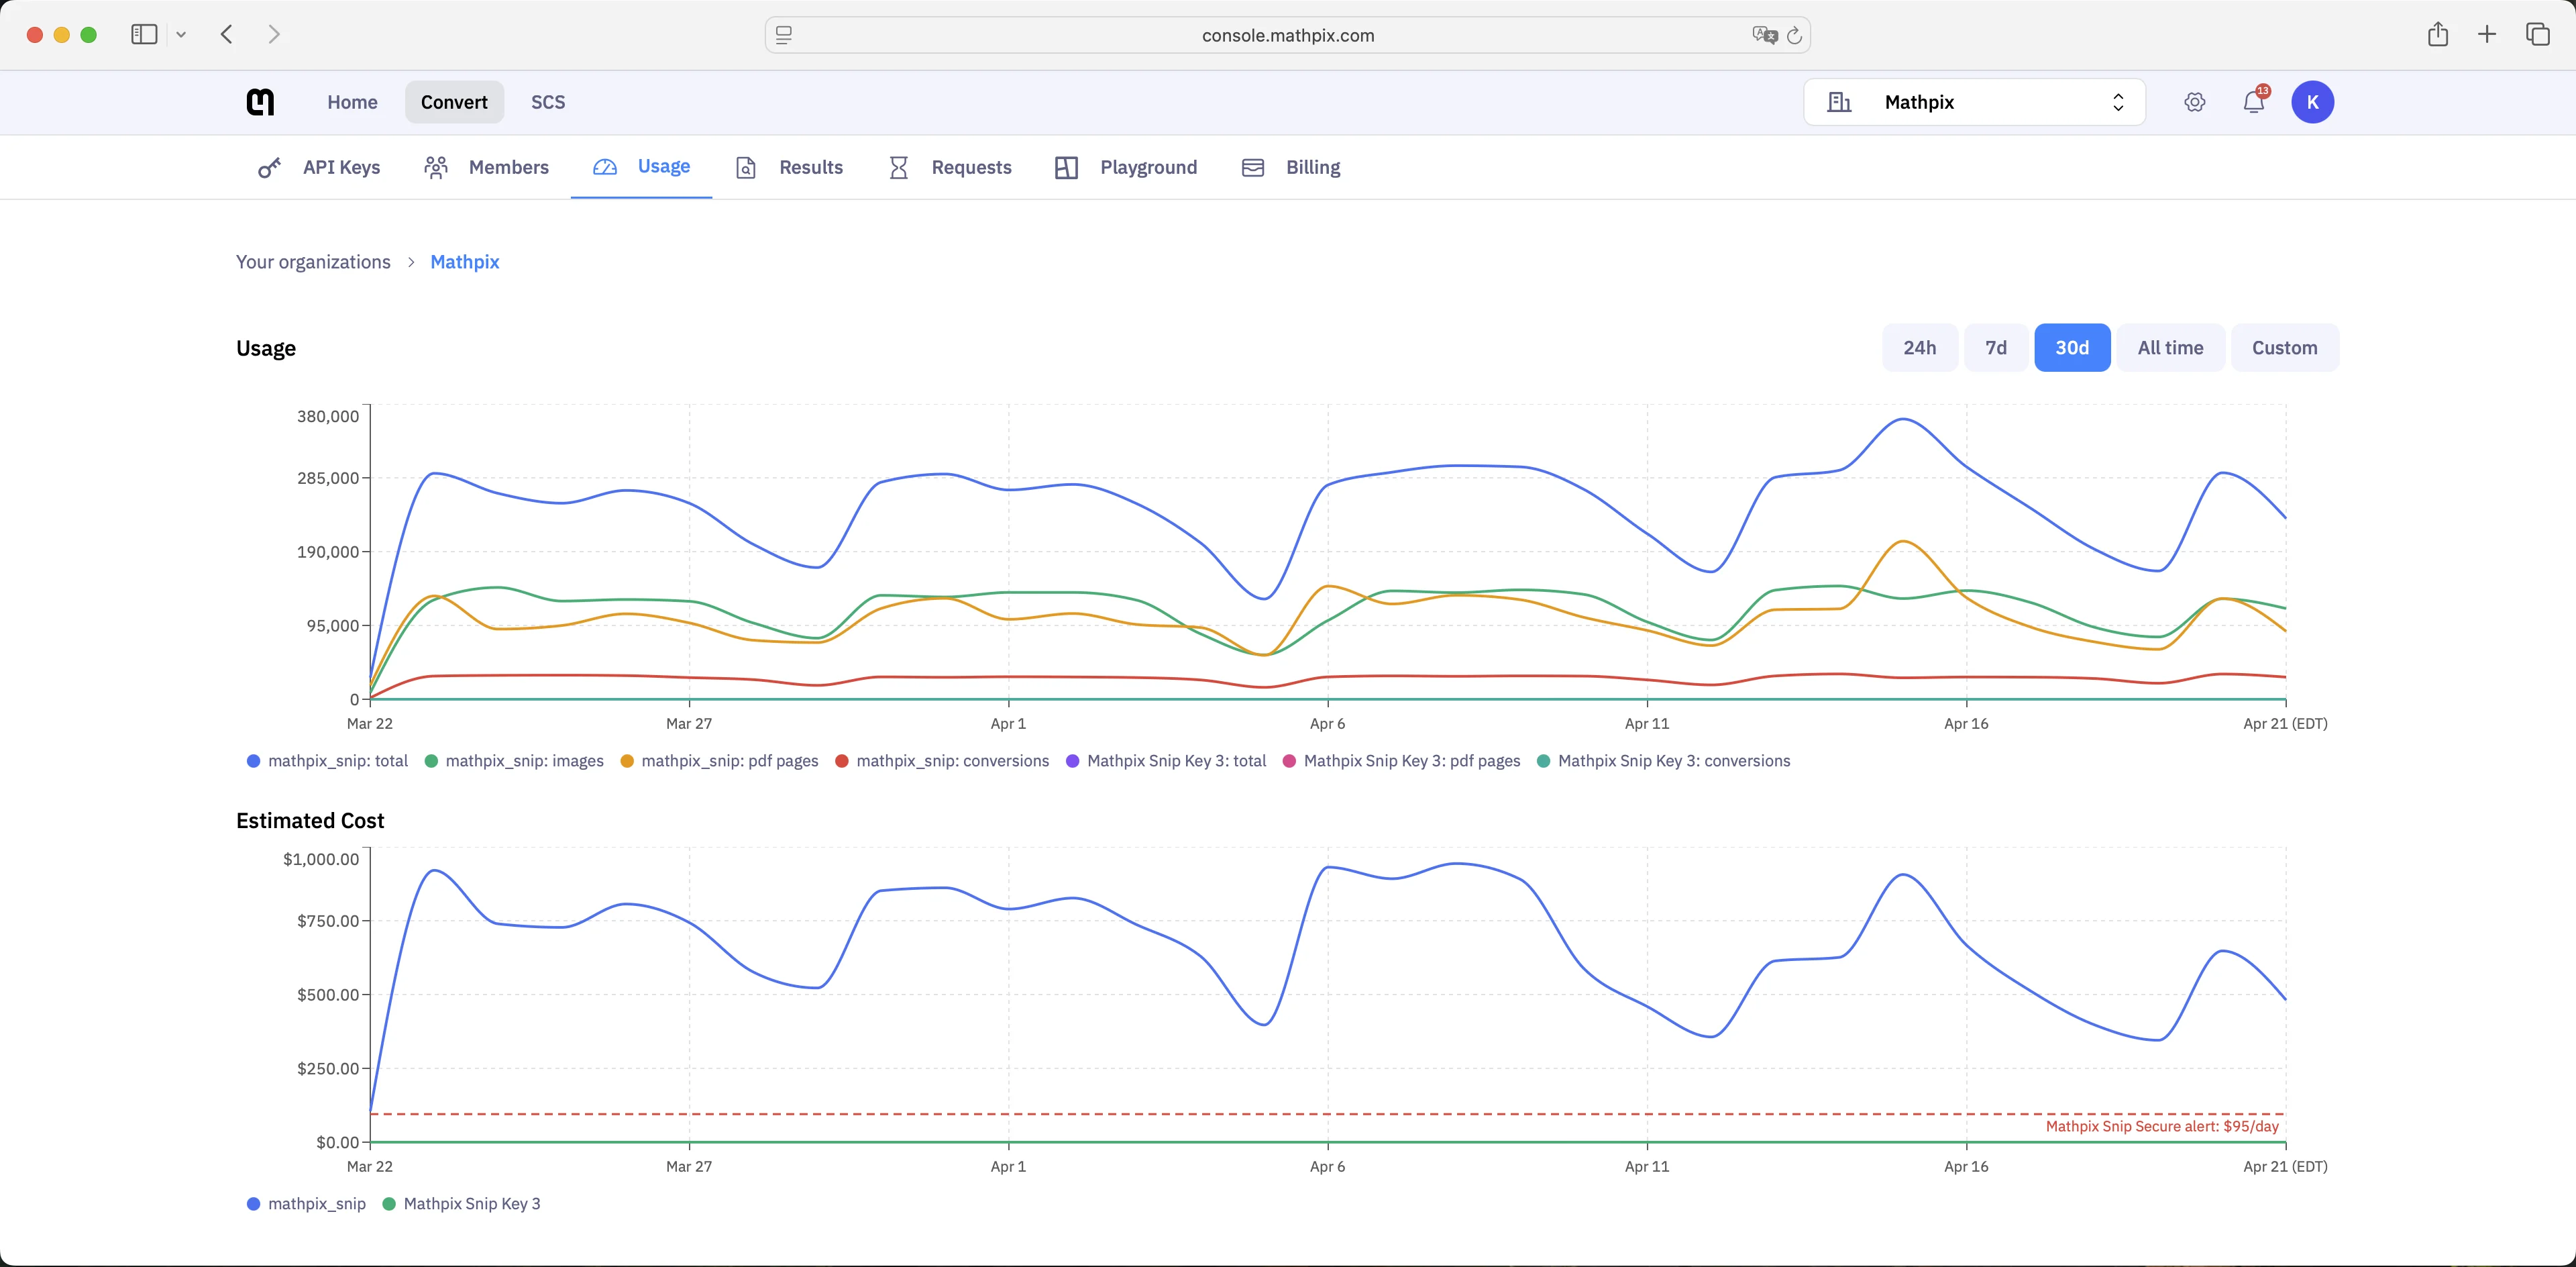
Two stacked time-series charts sit at the top of the Usage tab:
- Requests over time - one line per API key, one color per key.
- Estimated Cost - the same time axis, with cost approximated from the pricing tables on the Billing page. Volume discounts, credits, and rounding are applied at invoice time, so this value is close to, but not exactly, your final invoiced amount.
Each chart supports five time-range tabs: 24h, 7d, 30d, All time, and a Custom date-range picker. Click a legend dot to hide or show that key’s line. When you have a daily burn-rate alert configured on a key, a red dashed line appears on the Estimated Cost chart at the configured threshold for that key.
Below the charts, Total Usage and API Key Usage tables break the same period down by usage type - images, PDF pages, and each conversion format.
Exporting usage to CSV
Every usage section has a download icon that exports exactly what that section is showing (total usage, the per-key breakdown, or a single key) over the time range currently selected on the page. Clicking it offers three granularities:
| Granularity | One row per | Available when |
|---|---|---|
| Hourly | hour | always |
| Daily | calendar day | the selected range covers at least 2 days |
| Monthly | calendar month | the selected range covers at least a month |
Granularities that do not fit the selected range are greyed out, with the reason on hover. Widen the range or switch to a preset to enable them.
The export is a plain CSV with a header row. A per-key export has the columns:
date,app_id,usage_type,count,estimated_cost_usd
2026-09-01,abc123_4d5e6f (ingest-pipeline),pdf-pages,18412,92.060
A total-usage export replaces
app_id with group_id. Rows with zero usage are omitted, and keys that have a name show it in parentheses after the app ID. estimated_cost_usd uses the same approximation as the Estimated Cost chart, so treat it as an estimate to reconcile against, not as an invoice.Files are named for what they contain, using
<key or group>-usage-<range>-<granularity>.csv, so exports from different ranges do not overwrite each other in your downloads folder.For the same data as JSON, on demand, use the
v3/ocr-usage endpoint.Usage alerts
The Usage Alerts card lets org admins configure automatic email alerts when a key spikes or exceeds a daily spend threshold. They are a guardrail against runaway spend from a bad deploy or a runaway loop.
Spike alerts
A spike alert fires when a key’s request count in the last completed hour exceeds
N × the key's average for the same hour-of-day over the previous 4 weeks, where N is the multiplier you configure. A typical starting value is 2 - i.e. alert when this key gets twice its usual hourly traffic. You pick the multiplier per key.Comparing against the same hour-of-day matters: it means a normal Monday-morning peak does not page you, but the same volume at 3am does.
To prevent repeated emails during a sustained spike, spike alerts are suppressed for approximately one hour after one fires for a given key.
Daily burn-rate alerts
A daily burn-rate alert fires when the rolling 24-hour estimated spend for a key exceeds the dollar threshold you configure (e.g.
$500/day). The rolling spend is computed from your current month-to-date tier, so it reflects what that 24-hour window is actually costing you given your current volume - not a flat per-unit rate. If the 24-hour window crosses a calendar month boundary, each month’s portion is priced from its own month-to-date total, which means the rolling spend can read low in the first hours of a new month even after heavy prior-month usage. The red dashed line on the Estimated Cost chart shows where your threshold is set, as a visual reference.Burn-rate alerts are suppressed for approximately 24 hours after one fires for a given key, to avoid a cascade of emails during a sustained overrun.
Configuring alerts
Click Set up alerts (or Add alert, if you already have one configured) on the Usage Alerts card to open the configuration modal:
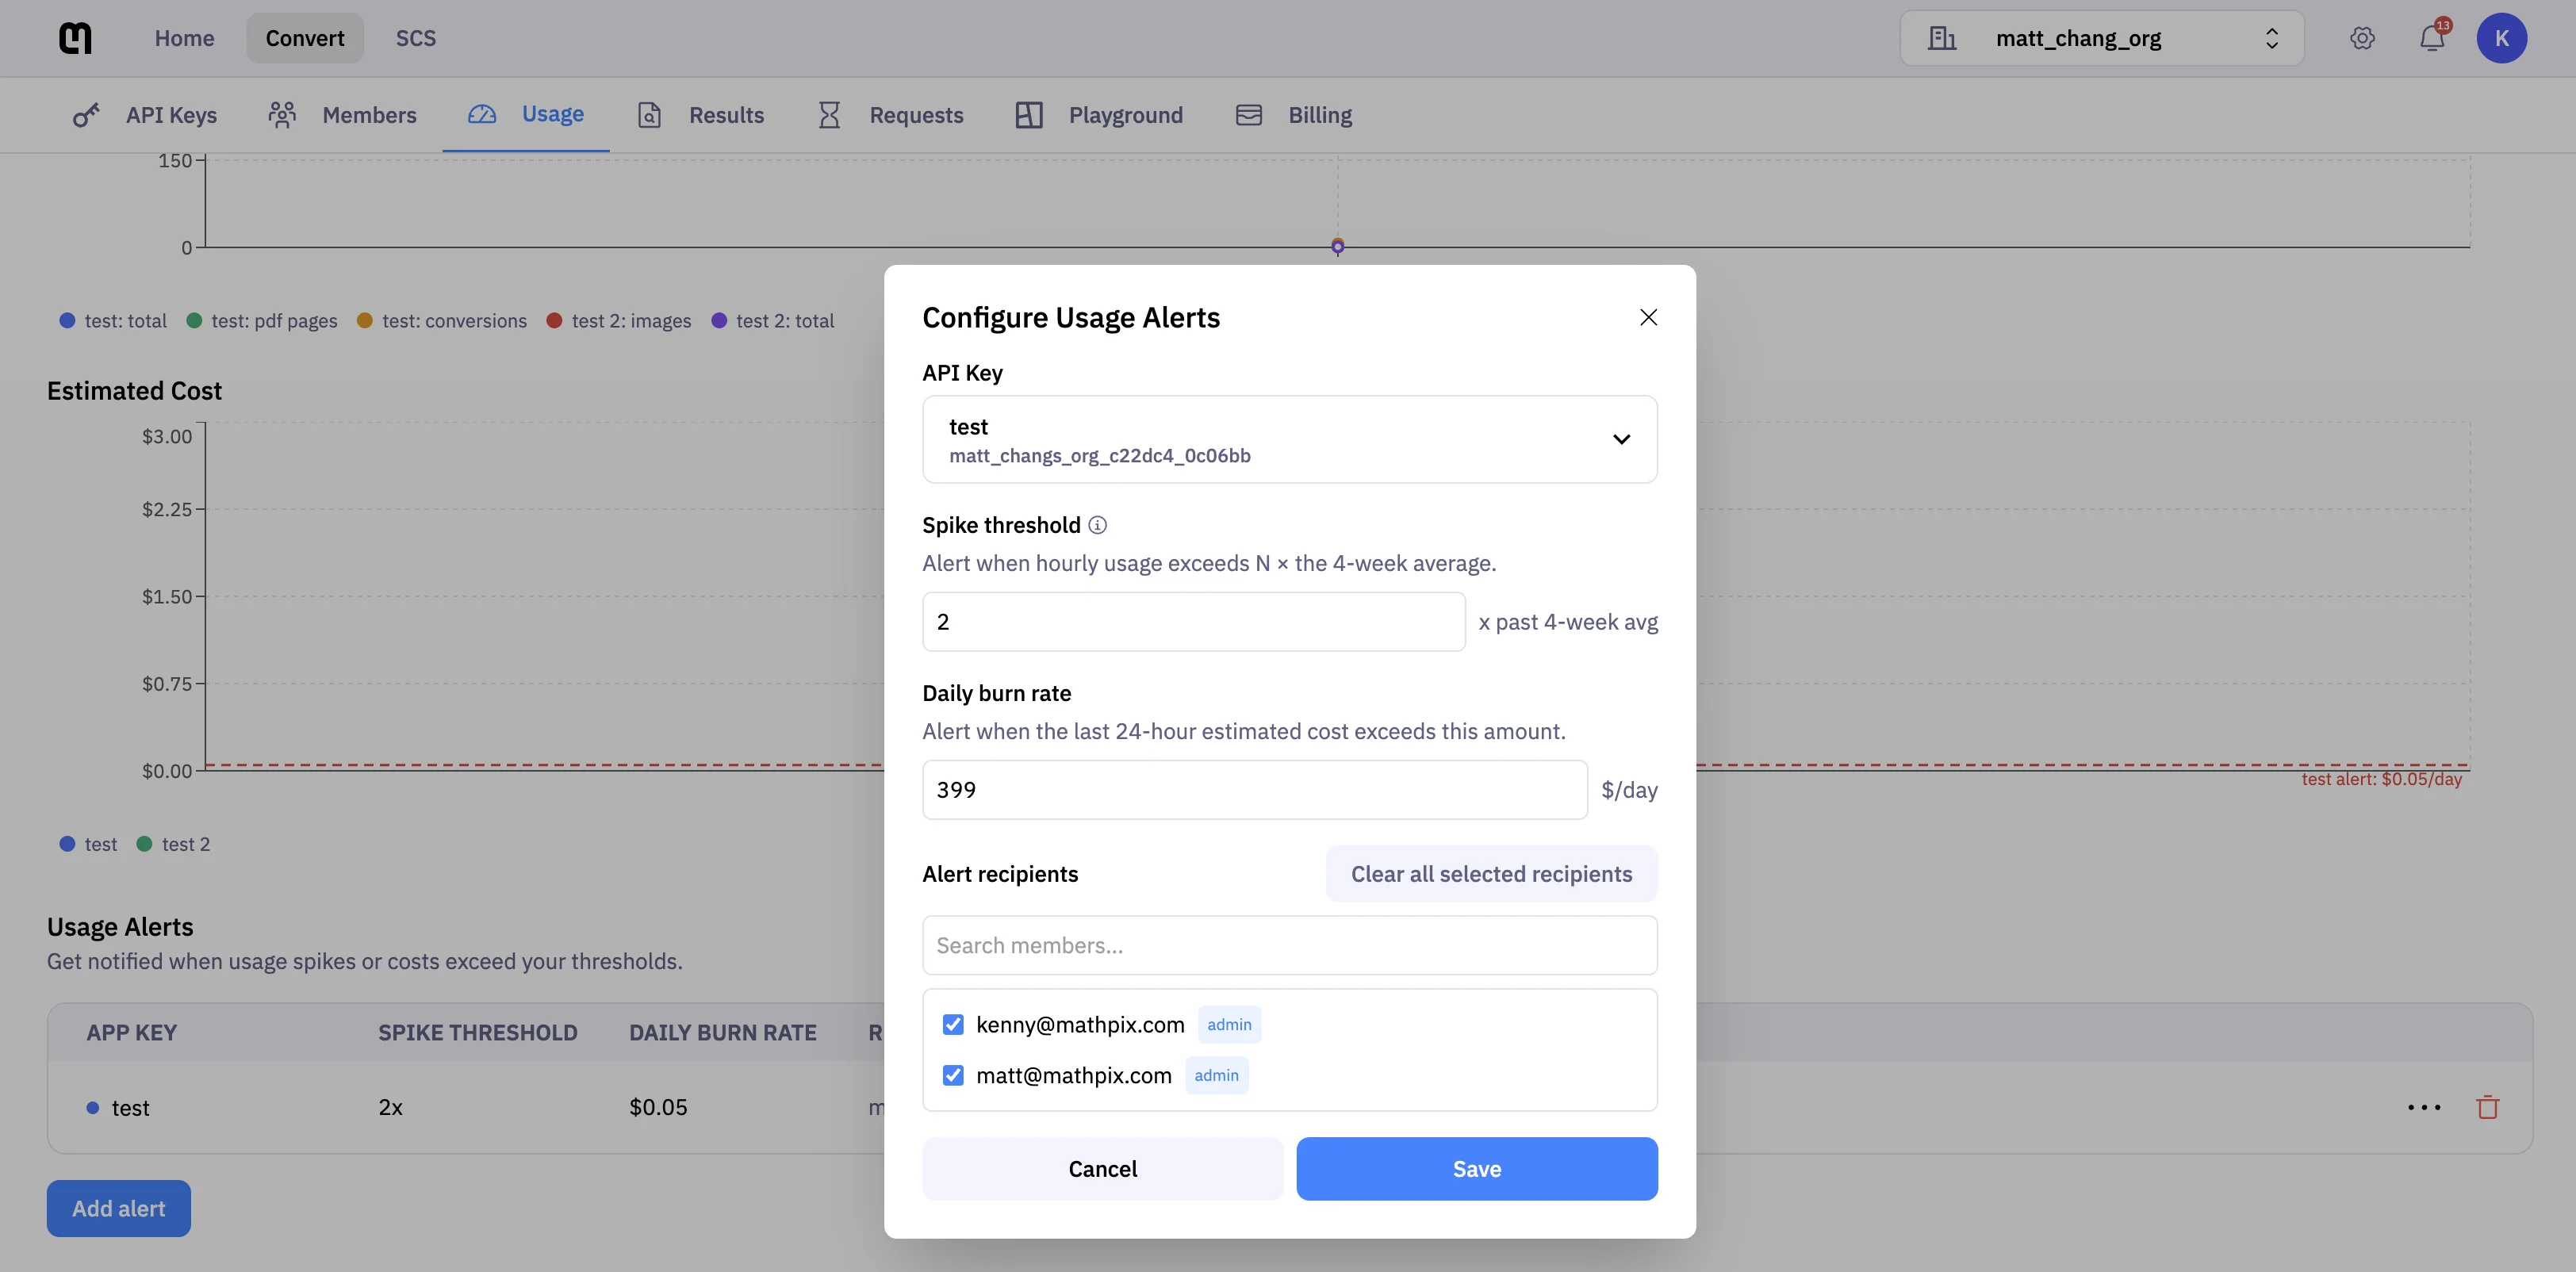
In the modal:
- Select an API key. Each key has its own thresholds and recipient list.
- Enter a spike multiplier, a daily burn rate, or both. At least one threshold is required to save.
- Pick recipients. The checkbox list is populated from your org members; admins are marked with a blue badge. Search filters the list. At least one recipient must be selected to save.
- Click Save.
Configuring or changing alerts requires the admin role on the organization. Members can view the Usage Alerts card but cannot change settings.
Alert emails are sent from
support@mathpix.com and link back to the Usage tab on Console.Alerts notify; they do not block. If you want requests actually rejected above a throughput ceiling, ask support for a lower rate limit - see Lowering a limit on purpose.
Results
The Results tab lists individual requests made with your API keys, newest first, with the image, request ID, date, recognized text, confidence, and the arguments the request was made with.
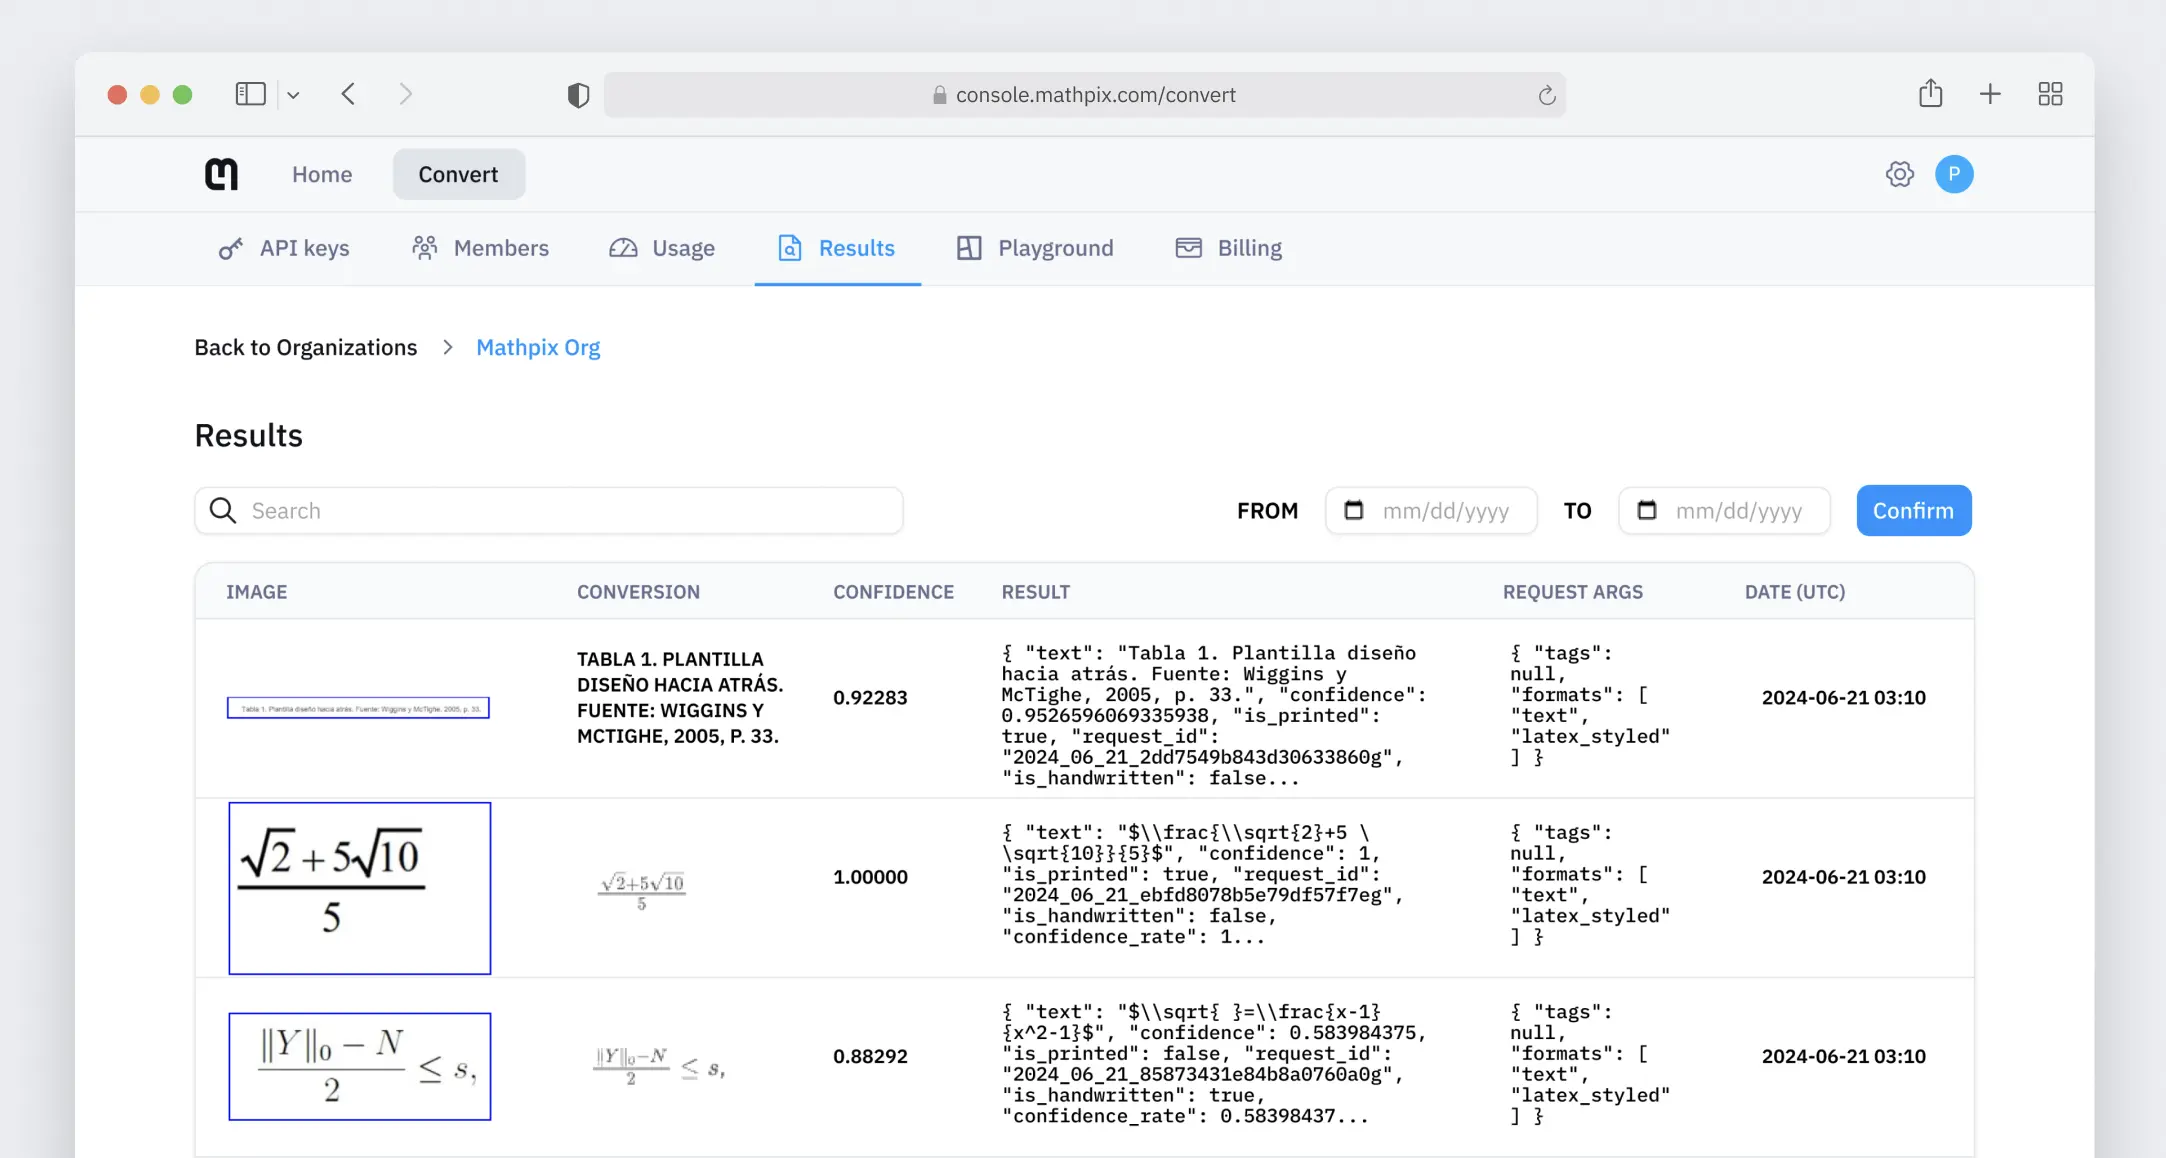
This is the tab to open when a specific conversion looked wrong: you can find the request, see the exact input, the exact output, and the options it ran with. The request ID is also what support will ask for.
Two things to know:
- Results only appear for requests made with
improve_mathpixenabled. If a key is configured not to retain images, its requests are processed normally but are not browsable here - see Privacy. - If no results appear at all, check that the key is enabled on the API Keys tab.
The same data is queryable from your own code via
v3/ocr-results for images and v3/pdf-results for documents.