We’ve deployed SuperNet-105, bringing a major improvement to figure processing: figure labels are now linked directly to diagrams, charts, and tables in our API outputs.
What’s new:
- Figure label detection + association
- We’ve introduced a new
figure_labeltype inlines.json(v3/pdf) andline_data(v3/text). - Figure labels (captions for diagrams, charts, tables) are now explicitly associated with their corresponding visuals using the new
selected_labelsfield.
- We’ve introduced a new
- Improved MMD output
- Figures and tables now include their captions inside LaTeX-style environments
This allows captions to be programmatically linked with their corresponding visuals, improving document understanding and search.
Example: Figure with Linked Label
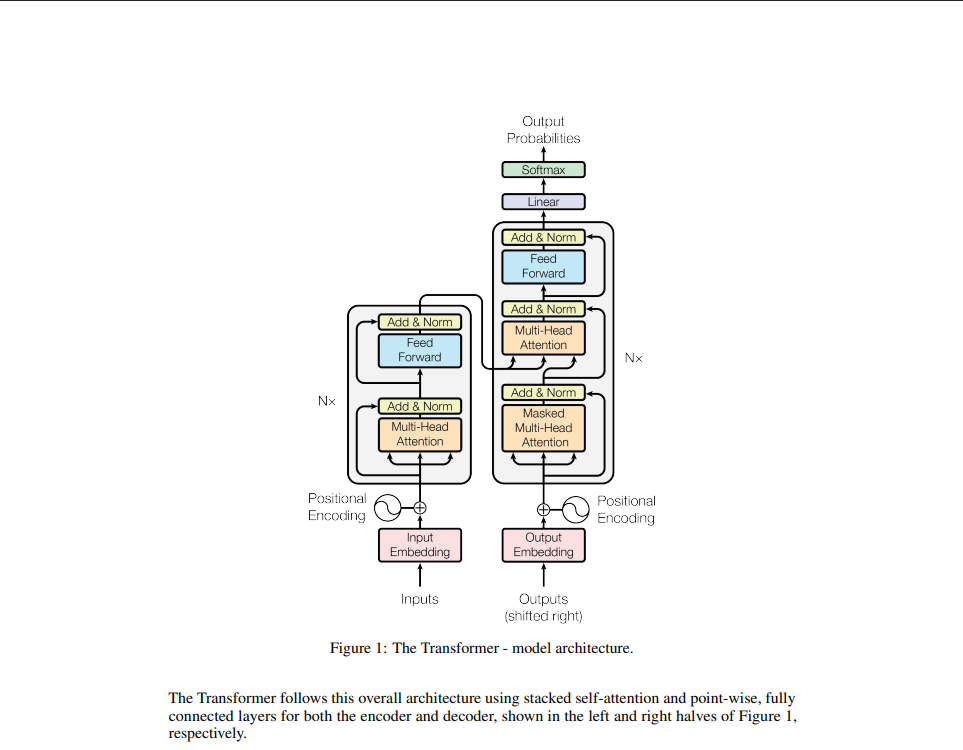
Here is the relevant part of the famous Attention Is All You Need paper:
MMD output:
\begin{figure}

\includegraphics[width=\textwidth]{https://cdn.mathpix.com/cropped/2025_08_04_a72bae3a0cdf39de5533g-03.jpg?height=1137&width=785&top_left_y=243&top_left_x=674}

\captionsetup{labelformat=empty}

\caption{Figure 1: The Transformer - model architecture.}

\end{figure}

The Transformer follows this overall architecture using stacked self-attention and point-wise, fully connected layers for both the encoder and decoder, shown in the left and right halves of Figure 1, respectively.
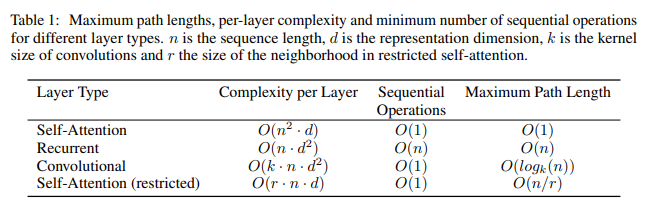
Example: Table with Linked Label
Input:
MMD Output:
\begin{table}

\captionsetup{labelformat=empty}

\caption{Table 1: Maximum path lengths, per-layer complexity and minimum number of sequential operations for different layer types. \(n\) is the sequence length, \(d\) is the representation dimension, \(k\) is the kernel size of convolutions and \(r\) the size of the neighborhood in restricted self-attention.}

\begin{tabular}{|l|l|l|l|}

\hline Layer Type & Complexity per Layer & Sequential Operations & Maximum Path Length \\

\hline Self-Attention & \(O\left(n^{2} \cdot d\right)\) & \(O(1)\) & \(O(1)\) \\

\hline Recurrent & \(O\left(n \cdot d^{2}\right)\) & \(O(n)\) & \(O(n)\) \\

\hline Convolutional & \(O\left(k \cdot n \cdot d^{2}\right)\) & \(O(1)\) & \(O\left(\log _{k}(n)\right)\) \\

\hline Self-Attention (restricted) & \(O(r \cdot n \cdot d)\) & \(O(1)\) & \(O(n / r)\) \\

\hline

\end{tabular}

\end{table}
Note: Plain Markdown export remains unchanged
Changes to lines.json output
In
lines.json, both the diagram and table in the examples above contain a reference to the associated figure label.Here’s a sample
lines.json output showing a figure and its linked label:[
{
"id": "5e101f1d2bb64263aada28cb60a19a39",
"cnt": [
[
675,
244
],
[
1458,
244
],
[
1458,
1380
],
[
675,
1380
]
],
"line": 1,
"text": "",
"type": "diagram",
"column": 0,
"region": {
"width": 785,
"height": 1137,
"top_left_x": 674,
"top_left_y": 243
},
"font_size": 28,
"is_printed": true,
"children_ids": ,
"text_display": "\n\n\\begin{figure}\n\\includegraphics[width=\\textwidth]{https://cdn.mathpix.com/cropped/2025_08_04_a72bae3a0cdf39de5533g-03.jpg?height=1137&width=785&top_left_y=243&top_left_x=674}\n\\captionsetup{labelformat=empty}\n\\caption{Figure 1: The Transformer - model architecture.}\n\\end{figure}",
"is_handwritten": false,
"selected_labels": [
"ab5309ed85104593830960a90fcb294d"
],
"conversion_output": true
},
{
"id": "ab5309ed85104593830960a90fcb294d",
"cnt": [
[
721,
1445
],
[
721,
1399
],
[
1401,
1399
],
[
1401,
1445
]
],
"line": 46,
"text": "Figure 1: The Transformer - model architecture.",
"type": "figure_label",
"column": 0,
"region": {
"width": 682,
"height": 47,
"top_left_x": 720,
"top_left_y": 1398
},
"font_size": 28,
"confidence": 1,
"is_printed": true,
"text_display": "",
"is_handwritten": false,
"confidence_rate": 1,
"conversion_output": false
}
]
Why does this matter?
In a previous update, we added the ability to detect text inside figures. This release goes further by structuring the relationship between figures/tables and their captions, making outputs more semantically rich and easier to use for downstream processing, search, and rendering.
Explore the full details in the Convert API changelog.